A chart recently surfaced across financial feeds that immediately sent shockwaves through both Wall Street and the AI engineering community.
Circulated by market commentator ZeroHedge, the post highlighted a sensitivity table attributed to Goldman Sachs Global Investment Research and Epoch AI:
“This could be a problem: Goldman sensitivity table shows that in a worst case scenario where hyperscaler ROIC on capex is 0 (token costs collapse, token demand goes to open models, etc) they still need to spend $920BN every year just to cover depreciation and running costs.”
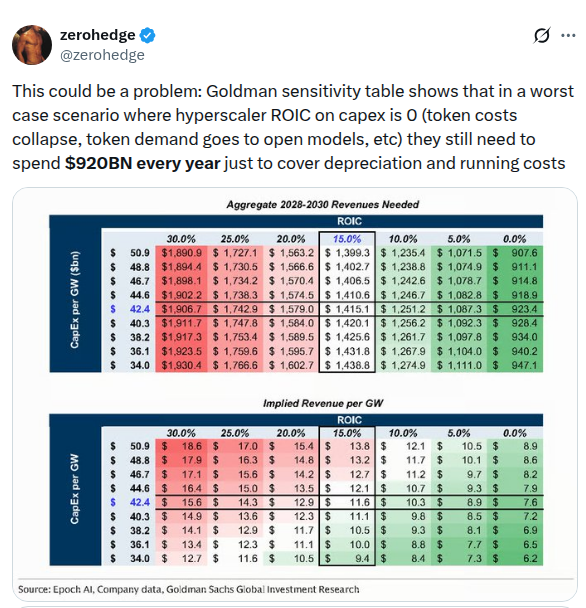
The post tapped directly into the single most intense anxiety haunting the 2026 technology landscape: the return on invested capital (ROIC) chasm.
After nearly three years of aggressive silicon procurement, multi-gigawatt power acquisitions, and astronomical capital expenditures, investors are asking a blunt question: What happens if token prices collapse, open-weights models commoditize the intelligence layer, and the anticipated revenue windfall fails to materialize?
However, when analyzing financial sensitivity models that dictate hundreds of billions of dollars in enterprise valuation, precision is mandatory.
A forensic examination of the underlying Goldman Sachs research reveals that while the social media narrative conflated key accounting terms and time horizons, the actual mathematical reality is arguably more consequential for the macro tech economy.
Let’s unpack the primary report, audit the arithmetic, dissect the unit economics per gigawatt, and analyze the existential tug-of-war between token deflation and agentic demand.
1. Fact-Checking the Panic: 3-Year Aggregate vs. Annual Run-Rate
The sensitivity matrix in question originates from a Goldman Sachs equity research report published on September 24, 2026, titled:
“Americas Technology: Sizing the AI Economy Needed to Justify ROIC on Hyperscaler AI Capex”
Authored by Eric Sheridan and the Goldman Sachs Americas Technology Team.
The report evaluates the six primary U.S. hyperscale and compute infrastructure operators driving the current buildout: Alphabet, Amazon, Microsoft, Meta, Oracle, and SpaceX. Specifically, it models the economic output necessary to justify their “Phase II” compute capital expenditures (2026–2027), estimated at an eye-watering $1.22 trillion.
Looking closely at the published table reveals where the viral commentary went astray—and where it hit the bullseye.
Error #1: Aggregate 3-Year Revenue vs. Annual Spending
Look at the title of Table 1:
Aggregate 2028-2030 Revenues NeededThe figures in that table—including the $923.4 billion highlighted at the base case ($42.4B Capex per GW at 0.0% ROIC)—represent the cumulative three-year aggregate revenue requirement from 2028 through 2030, not an annual run-rate.
- Viral Claim: Hyperscalers need to spend $920 billion every single year.
- Actual Goldman Math: The six hyperscalers need to generate approximately $923 billion cumulatively over 3 years, which translates to approximately $307.8 billion per year across the cohort.
The viral post mistakenly tripled the annual revenue burden.
Error #2: Cash “Spend” vs. Accounting Breakeven Revenue
The viral tweet claimed hyperscalers “need to spend $920BN every year just to cover depreciation and running costs.”
In corporate finance, ROIC = NOPAT / Invested Capital. When ROIC is 0.0%, Net Operating Profit After Tax (NOPAT) is zero. That means Operating Income ($EBIT$) is zero: $$\text{Revenue} = \text{Cash Operating Expenses} + \text{Depreciation & Amortization}$$
The $923 billion three-year figure is Revenue Needed, not incremental cash outlay:
- Cash Operating Expenses (Power, Cooling, Maintenance, Grid Fees): Modeled by Goldman at ~$836 million per GW annually. Across ~40.6 GW of deployed infrastructure, that equals ~$34 billion per year in actual operational cash burn.
- Depreciation (Non-Cash Amortization of Prior Capex): The remaining ~$274 billion per year represents the straight-line accounting depreciation of the $1.22+ trillion in servers, silicon, liquid cooling distribution units, and data halls deployed during Phase II.
Why Debunking the Myth Doesn’t Soften the Blow
Correcting the number from $920 billion/year down to $308 billion/year corrects a reading error, but it does not solve the hyperscalers’ crisis.
Consider the baseline context of the enterprise software and cloud industry in 2026:
- Total annualized revenue for Amazon Web Services (AWS) is ~$105 billion.
- Total annualized revenue for Microsoft Azure is ~$75 billion.
- Total annualized revenue for Google Cloud Platform (GCP) is ~$45 billion.
The entire global public cloud infrastructure market today generates between $320 billion and $360 billion in total annual revenues—accumulated over nearly two decades of digital transformation, enterprise ERP migrations, database hosting, and web services.
Goldman’s sensitivity table proves that hyperscalers must generate the equivalent of an entire second AWS + Azure + GCP combined ($308B/year) exclusively from AI workloads simply to reach ZERO percent economic profit.
If cumulative 2028–2030 AI revenues come in at $200 billion/year instead of $308 billion, ROIC turns sharply negative. In that regime, the largest technology balance sheets in the world will be forced into massive GAAP impairment charges and multi-hundred-billion-dollar asset write-downs.
2. Deconstructing the Goldman Sensitivity Model
To understand how Goldman arrived at these thresholds, we need to inspect the underlying mechanical parameters: CapEx per Gigawatt (GW), power capacity, and asset lifespan.
The Two Sensitivity Matrices
Here is the exact data from Goldman Sachs Global Investment Research (with data inputs from Epoch AI and company filings):
Table 1: Aggregate 2028–2030 Revenues Needed ($bn)
| CapEx per GW ($bn) | 30.0% ROIC | 25.0% ROIC | 20.0% ROIC | 15.0% ROIC (Base) | 10.0% ROIC | 5.0% ROIC | 0.0% ROIC (Breakeven) |
|---|---|---|---|---|---|---|---|
| $50.9 | $1,890.9 | $1,727.1 | $1,563.2 | $1,399.3 | $1,235.4 | $1,071.5 | $907.6 |
| $48.8 | $1,894.4 | $1,730.5 | $1,566.6 | $1,402.7 | $1,238.8 | $1,074.9 | $911.1 |
| $46.7 | $1,898.1 | $1,734.2 | $1,570.4 | $1,406.5 | $1,242.6 | $1,078.7 | $914.8 |
| $44.6 | $1,902.2 | $1,738.3 | $1,574.5 | $1,410.6 | $1,246.7 | $1,082.8 | $918.9 |
| $42.4 (Base) | $1,906.7 | $1,742.9 | $1,579.0 | $1,415.1 | $1,251.2 | $1,087.3 | $923.4 |
| $40.3 | $1,911.7 | $1,747.8 | $1,584.0 | $1,420.1 | $1,256.2 | $1,092.3 | $928.4 |
| $38.2 | $1,917.3 | $1,753.4 | $1,589.5 | $1,425.6 | $1,261.7 | $1,097.8 | $934.0 |
| $36.1 | $1,923.5 | $1,759.6 | $1,595.7 | $1,431.8 | $1,267.9 | $1,104.0 | $940.2 |
| $34.0 | $1,930.4 | $1,766.6 | $1,602.7 | $1,438.8 | $1,274.9 | $1,111.0 | $947.1 |
Table 2: Implied Annual Revenue Needed per GW ($bn)
| CapEx per GW ($bn) | 30.0% ROIC | 25.0% ROIC | 20.0% ROIC | 15.0% ROIC (Base) | 10.0% ROIC | 5.0% ROIC | 0.0% ROIC (Breakeven) |
|---|---|---|---|---|---|---|---|
| $50.9 | $18.6 | $17.0 | $15.4 | $13.8 | $12.1 | $10.5 | $8.9 |
| $48.8 | $17.9 | $16.3 | $14.8 | $13.2 | $11.7 | $10.1 | $8.6 |
| $46.7 | $17.1 | $15.6 | $14.2 | $12.7 | $11.2 | $9.7 | $8.2 |
| $44.6 | $16.4 | $15.0 | $13.5 | $12.1 | $10.7 | $9.3 | $7.9 |
| $42.4 (Base) | $15.6 | $14.3 | $12.9 | $11.6 | $10.3 | $8.9 | $7.6 |
| $40.3 | $14.9 | $13.6 | $12.3 | $11.1 | $9.8 | $8.5 | $7.2 |
| $38.2 | $14.1 | $12.9 | $11.7 | $10.5 | $9.3 | $8.1 | $6.9 |
| $36.1 | $13.4 | $12.3 | $11.1 | $10.0 | $8.8 | $7.7 | $6.5 |
| $34.0 | $12.7 | $11.6 | $10.5 | $9.4 | $8.4 | $7.3 | $6.2 |
(Source: Epoch AI, Company data, Goldman Sachs Global Investment Research)
Dissecting the Unit Economics of a Gigawatt
Notice the core assumptions driving Sheridan’s framework:
-
Total Capacity Modeled: ~40.6 GW Dividing the cumulative base-case revenue ($1,415.1B) by the three-year revenue per GW ($11.6B × 3 = $34.8B) yields exactly 40.66 Gigawatts of AI compute infrastructure deployed across the six hyperscalers by 2027.
- Context: 40 GW is roughly the entire average power load of the United Kingdom, or the output of 40 commercial nuclear reactors. Hyperscalers are building an entire industrialized nation’s power equivalent in server halls within a 36-month window.
-
Upfront Capital Intensity: $42.4 Billion per GW Building out 1 GW of modern AI capacity is radically different from traditional hyperscale cloud:
- Silicon & Accelerated Servers (~75-80%): NVIDIA Blackwell (GB200/B300) NVL72 racks, Rubin clusters, custom ASICs (Google TPU v6/v7, AWS Trainium 3). At ~$3 million to $3.5 million per fully populated high-density liquid-cooled rack (120kW to 132kW), the servers alone devour over $30 billion per GW.
- High-Bandwidth Interconnect (~10%): 800G/1.6T optical transceivers, co-packaged optics, spine-and-leaf InfiniBand/ROCE networking fabric.
- Power, Cooling & Civil Shell (~10-15%): Liquid-to-liquid CDUs (Coolant Distribution Units), high-voltage substations, backup battery arrays, and behind-the-meter utility interconnections.
-
Depreciation Schedules: The 5-Year Hardware Trap Goldman models compute hardware on a 5-year straight-line depreciation schedule and physical facilities on a 15-year schedule.
- Because roughly 80% of the $42.4B/GW is compute silicon and networking, that asset block depreciates at 20% per year.
- On $34 billion of silicon per GW, that generates $6.8 billion per year per GW in pure depreciation.
- Add the physical shell depreciation (~$0.55B/GW) plus Goldman’s estimated annual operating cash expense ($0.836B/GW for electricity, water, facility personnel, and maintenance), and the total baseline cost per GW is: $$$6.8\text{B} + $0.55\text{B} + $0.84\text{B} \approx \mathbf{$8.2\text{B} \text{ per GW per year}}$$
- After factoring in working capital and corporate overhead allocations, this aligns directly with Goldman’s modeled $7.6B to $8.9B annual revenue threshold per GW at 0% ROIC.
Unit Economics of 1 Gigawatt (GW) AI Infrastructure
----------------------------------------------------------------------
Upfront Capex:                   $42,400,000,000 ($42.4B)
  - Compute Silicon & Racks:     ~$34,000,000,000 (80%)
  - Power, Cooling & Building:   ~$8,400,000,000 (20%)
----------------------------------------------------------------------
Annual Depreciation Charge:      ~$7,350,000,000 / year
Annual Cash OpEx (Power/Cool):   ~$836,000,000 / year
----------------------------------------------------------------------
Baseline Breakeven Revenue (0%): ~$7.6B - $8.2B / GW / year
Required 15% ROIC Revenue:       $11.6B / GW / year
----------------------------------------------------------------------
3. The Counter-Intuitive Inverse Capex Paradox
If you look closely at Table 1 and Table 2, an intriguing mathematical anomaly emerges:
- In Table 1 (Aggregate Revenue): As Capex per GW falls from $50.9B down to $34.0B, the total required revenue increases slightly (from $1,890.9B to $1,930.4B at 30% ROIC, and from $907.6B to $947.1B at 0% ROIC).
- In Table 2 (Per-GW Revenue): As Capex per GW falls, the implied revenue per GW drops sharply (from $18.6B down to $12.7B at 30% ROIC, and from $8.9B down to $6.2B at 0% ROIC).
Why does total required revenue rise when unit capex drops?
Because Goldman holds the total aggregate capital expenditure fixed ($1.22 trillion in Phase II compute). If the cost per GW declines from $50.9B to $34.0B, the hyperscalers don’t spend less money overall; they build significantly more gigawatts of capacity (expanding from ~24 GW to ~36 GW of new buildout).
More gigawatts deployed means a much larger physical footprint of data centers to power, staff, insure, and maintain ($836 million in cash OpEx per GW per year). Thus, operational expenses compound across more facilities, lifting the aggregate top-line revenue required to clear depreciation and overhead.
4. The Anatomy of a Zero-ROIC Nightmare
Why did ZeroHedge and macro bears seize on the 0.0% ROIC column?
In equity valuation, hyperscalers trade at enterprise value multiples of 25x–35x forward earnings because investors price in high incremental ROIC (typically 20% to 30% for cloud businesses). If ROIC drops to 0%, the enterprise value of that capital investment is essentially wiped out.
Three structural forces threaten to push the industry toward this zero-ROIC scenario:
                      THE ZERO-ROIC SQUEEZE

   [ Algorithmic Efficiency ]      [ Open-Weights Models ]
     (Inference cost drops           (Llama / DeepSeek / Qwen
      10x every 18 months)            strip away API pricing)
              \                                /
               \                              /
                v                            v
          +----------------------------------------+
          |      PLUNGING TOKEN REALIZED VALUE     |
          |  Hyperscalers sell commodity tokens    |
          |      at collapsing gross margins       |
          +----------------------------------------+
                              |
                              v
          +----------------------------------------+
          |    THE 5-YEAR HARDWARE HALF-LIFE       |
          |  $42.4B/GW must be amortized over      |
          |   60 months before silicon expires     |
          +----------------------------------------+
                              |
                              v
          +----------------------------------------+
          |   ANNUAL REVENUE DEFICIT: <$308B/YR    |
          |    GAAP Impairment & Capital Destr.    |
          +----------------------------------------+
1. The Token Deflation Treadmill & Jevons Paradox Failure
Epoch AI and industry benchmarks show that inference costs have fallen by nearly an order of magnitude every 12 to 18 months.
- Architectural breakthroughs—such as DeepSeek’s Multi-head Latent Attention (MLA), quantized FP4/FP8 execution, speculative decoding, and mixture-of-agents architectures—have radically cut the FLOPs required to generate high-quality tokens.
- In classical economics, Jevons Paradox states that as a resource becomes more efficient and cheaper to produce, total consumption increases.
- But for hyperscalers to make money on Jevons Paradox, elasticity of demand must significantly exceed 1.0. If inference pricing falls by 90% and enterprise token consumption only triples (300% growth), total gross revenue contracts by 70%.
2. The Open-Weights Commodity Squeeze
Proprietary frontier models (OpenAI, Anthropic, Google Gemini) initially commanded premium pricing ($15–$30 per million output tokens).
However, open-weights models (Meta’s Llama family, DeepSeek, Alibaba’s Qwen, Mistral) have systematically closed the capability gap on coding, reasoning, and instruction-following benchmarks.
Enterprise CIOs are increasingly deploying fine-tuned, quantized open-weights models on internal clusters or via commodity third-party infrastructure (Together AI, Fireworks, Lambda Labs) at a fraction of the cost. This dynamics strips away the 75%+ software margins of proprietary APIs, compressing hyperscalers into low-margin infrastructure utilities.
3. The 5-Year GPU Half-Life: Telecom Fiber vs. Silicon
During the 1999–2000 telecom bubble, telecom giants (WorldCom, Global Crossing) overbuilt transcontinental fiber networks. When the bubble burst, the fiber sat unlit in the ground. Crucially, dark fiber does not rust, degrade, or consume 1,000 watts of power while idle. Five to ten years later, rising internet video traffic (YouTube, Netflix) lit that fiber at virtually zero incremental capex.
AI clusters have no such luxury.
- High-power GPUs run hot (80°C–90°C), experience physical thermal stress, and require high continuous base load power just to stay networked.
- More devastating is technological obsolescence: an H100 or B200 cluster depreciates on the balance sheet across 60 months. But when a next-generation architecture (Rubin or custom 2nm ASICs) delivers 3x–5x better performance-per-watt in 2028, older clusters become economically uncompetitive to operate against current grid electricity costs.
- If a hyperscaler fails to monetize its $42B/GW buildout in Years 1–3, the assets cannot be saved for later. They become stranded silicon.
5. The Bull Case Defense: Can Agentic AI and Backlogs Save the Cycle?
Eric Sheridan’s Goldman Sachs report is not a bearish eulogy; rather, it sets up the mathematical benchmarks to prove what the bulls must achieve. Goldman argues that the required revenue scale—$1.42 trillion over 2028–2030 for a 15% ROIC—is attainable through two primary pillars:
1. The $1.69 Trillion Cloud Backlog
As of the second quarter of 2026, the three major cloud providers (Amazon, Microsoft, Google) held a combined Remaining Performance Obligation (RPO) backlog of $1.69 trillion.
- Goldman points out that the cumulative AI revenue requirement ($1.0T to $1.42T) represents roughly 59% of existing contractual cloud backlog commitments.
- This indicates that enterprise customers have already signed multi-year legal agreements to spend massive sums on cloud infrastructure.
The Skeptic’s Caveat: RPO backlogs represent total corporate IT spend—including core relational databases, SAP/Workday hosting, virtual desktops, and object storage. They are not dedicated, non-cancelable AI token budgets. If enterprise macro budgets tighten, customer burn rates on backlogs slow dramatically.
2. The Paradigm Shift: From Chatbots to Agentic AI
The ultimate bull defense rests on the structural shift from Conversational AI to Agentic AI.
Token Consumption Comparison: Chatbot vs. Autonomous Agent
----------------------------------------------------------------------
Conversational Query (e.g. ChatGPT):
  - User Prompt + Answer:              ~500 - 1,500 tokens
  - Cost per interaction:              <$0.005

Agentic Multi-Step Task (e.g. Code Refactor / Forensic Audit):
  - System Prompt + AST Analysis:      ~50,000 tokens
  - Recursive Reflection & Tool Calls: ~350,000 tokens
  - Test Execution & Self-Correction:  ~400,000 tokens
  - Total Tokens Consumed:             ~800,000 - 2,500,000 tokens
  - Cost per interaction:              $2.00 - $10.00
----------------------------------------------------------------------
Multiplier on Token Volume:            1,000x - 2,000x per task
When human users interact with an AI via a chat prompt, token volume is bounded by human reading speed.
In contrast, Agentic AI systems run autonomously in loops: fetching repository context, searching documentation, executing terminal commands, evaluating test suites, and retrying upon failure. A single complex engineering or business task can easily consume several million tokens.
If autonomous agent workflows become standard across software engineering, legal compliance, supply chain logistics, and customer service, global token volume will not grow by 300%—it will grow by 10,000% to 100,000%.
That is the volume explosion required to defeat the token deflation treadmill and generate $472 billion in annual high-margin revenues.
6. Synthesis: The Capital Cycle Verdict
The viral tweet from ZeroHedge was factually inaccurate in its reading of the table headers, mistaking a 3-year aggregate figure for an annual cash expenditure.
Yet, like many market memes, its instinctive cynicism captured the core dilemma better than sanitized corporate press releases:
- The Floor is Existential: Even after correcting the arithmetic, hyperscalers face a $308 billion annual revenue hurdle merely to cover cash OpEx and asset depreciation. Falling short of this floor means negative ROIC, asset write-downs, and multiple compression.
- The 15% ROIC Hurdle is Enormous: Generating $1.42 trillion over 2028–2030 ($472B/year) requires AI to become the largest single revenue-generating technology transition in modern corporate history in less than four years.
- The Race Against Obsolescence: Unlike 19th-century railroads or 20th-century telecom fiber, GPU infrastructure burns the candle at both ends: high continuous operating expenses on one side, and rapid 5-year technological obsolescence on the other.
The next 24 months will reveal whether Agentic AI can trigger a massive Jevons Paradox expansion that fills 40.6 gigawatts of compute—or whether the tech industry is barreling toward the most expensive depreciation cliff ever constructed.